EDEXCEL A LEVEL ECONOMICS NOTES - 1.2 How markets work
1.2.1 Rational decision making
a) The underlying assumptions of rational economic decision making:
We often assume that people and businesses behave in a rational way. This means they make decisions logically to achieve the best possible outcome for themselves. These assumptions help economists predict behaviour, although in real life people do not always act rationally.
- Consumers aim to maximise utility
Utility: The satisfaction or happiness gained from consuming goods and services. The more satisfaction, the higher the utility.
Consumers compare the pros and cons of different choices and try to get the best value for money.
Key assumptions:
- Consumers can make logical decisions based on prices and incomes
- Consumers have clear preferences
Exam tip: In evaluation, you can say that consumers may not act rationally because they act emotionally, they may lack information and therefore do not have clear preferences, or they may be influenced by their environment or trends
o firms aim to maximise profits
What is profit?
Profit = total revenue − total costs
Revenue: P × Q → this is the total money made from the sale of goods and services.
Costs: expenses to the business, for example wages, rent, and raw materials.
Why do profits matter?
Profits can be reinvested to expand the business, for example into R&D.
They help firms survive in competitive markets.
Exam tip: In evaluation, you can mention that firms may also aim to increase market share, survive, or act ethically, especially in the short run. Firms operate in uncertain conditions in the real world, which makes it difficult to profit maximise and always act rationally.
1.2.2 Demand
a) The distinction between movements along a demand curve and shifts of a demand curve
Definition: A consumer's ability and willingness to buy a product at a given price within any given time period.
Negative Relationship between Price and Quantity Demanded
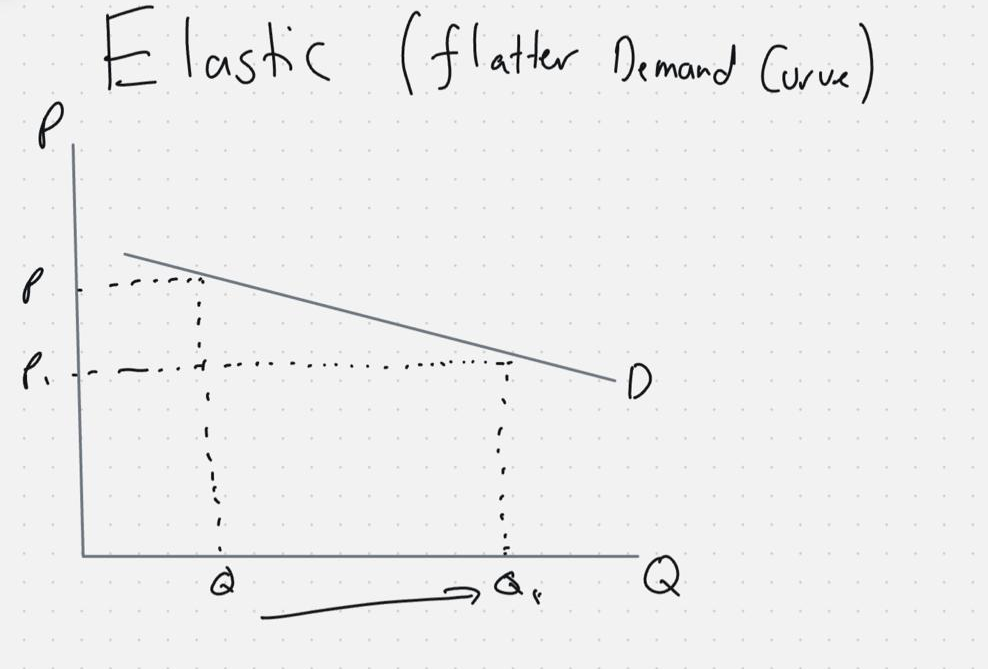
- There is a negative correlation between the price a consumer pays and the quantity demanded. This is because a higher price will take a larger proportion of the consumer's income, and will hence result in them demanding less of the product. This can be seen in the diagram below, as when the price increases from P to P1, there is a movement along the demand curve and a contraction in demand from Q to Q1.
What causes a movement along the demand curve
A change in price causes you to move from one point of the demand curve to another point.
SHIFT: A rightward shift in the demand curve means that consumers are willing to buy higher quantities and every given price level.
b) The factors that may cause a shift in the demand curve (the conditions of demand)
- Income: if you have more income, consumers have more spending power, so the demand curve will shift to the right so quantity demanded will rise at every given price.
- Trends/tastes: Consumer tastes may change over time and they may favor the good more. This can result in a rightward shift (increase) in the demand curve.
- Prices of substitutes: These are goods that compete with each other. For example, if the price of apples increases, the demand for bananas may increase (shift to the right).
- Prices of compliments: These are goods which are usually demanded together. For example for a tracksuit, if the price of the top increases, the demand for the bottoms will decrease (shift)
- Size of the population: more people will mean there's more people who are willing to buy the product.
- Advertising: can persuade a consumer to favour the product.
c) The concept of diminishing marginal utility and how this influences the shape of the demand curve
Marginal Utility (MU): The extra satisfaction you get from consuming on more unit of a good.
For example, the extra satisfaction i got from eating the second snickers bar.
Diminishing MU: Marginal utility falls as you consume more. For example, the fifth slice of the pizza does not bring you as much satisfaction as the first slice.
1st slice: Very enjoyable (high MU)
2nd slice: Still good, but less enjoyable
Third slice: even less enjoyable
If a unit gives a high MU , the consumer is willing to pay a high price.
If a unit gives a low MU: the consumer is willing to pay a lower price.
The demand curve shows how much a consumer is willing to buy at different prices. At high prices, only units with a high MU are worth buying → low QD.
At low prices, even units with low MU are worth buying → higher QD.
Summary:
- As more units of a good are consumed, MU falls.
- This reduces the consumers willingness to pay for additional units.
- Therefore, at lower prices, consumers demand a greater Q of the good.
Because marginal utility diminishes as consumption increases, consumers are only willing to purchase additional units at lower prices, which explains the downward sloping demand curve.
1.2.3 Price, income and cross elasticities of demand
a) Understanding of price, income and cross elasticities of demand
PED (price): The sensitivity or responsiveness of demand to a change in price.
FORMULA: Percentage change in QD/Percentage change in price
Note: % change: [(New-Old)/Old] x100
YED (Income): The responsiveness in demand to a change in income.
Formula: % Change in demand / % change in income
XED (Cross): The responsiveness of demand for good x, to a change in the price of good y.
Formula: % change in QD (for good x)/% change in price (for good y)
c) Interpret numerical values of
o price elasticity of demand: unitary elastic, perfectly and relatively elastic, and perfectly and relatively inelastic
Elastic demand: Demand is very responsive to a change in price (PED > 1). For example, if price increases by 10% and demand falls by 12%, PED is −1.2.
Inelastic demand: Demand is not very responsive to a change in price (PED < 1). For example, if price falls by 10% and demand increases by 8%, PED is −0.8, which is inelastic.
Unitary elastic demand: The percentage change in demand is equal to the percentage change in price. For example, if price increases by 10% and demand falls by 10%, PED = 1.
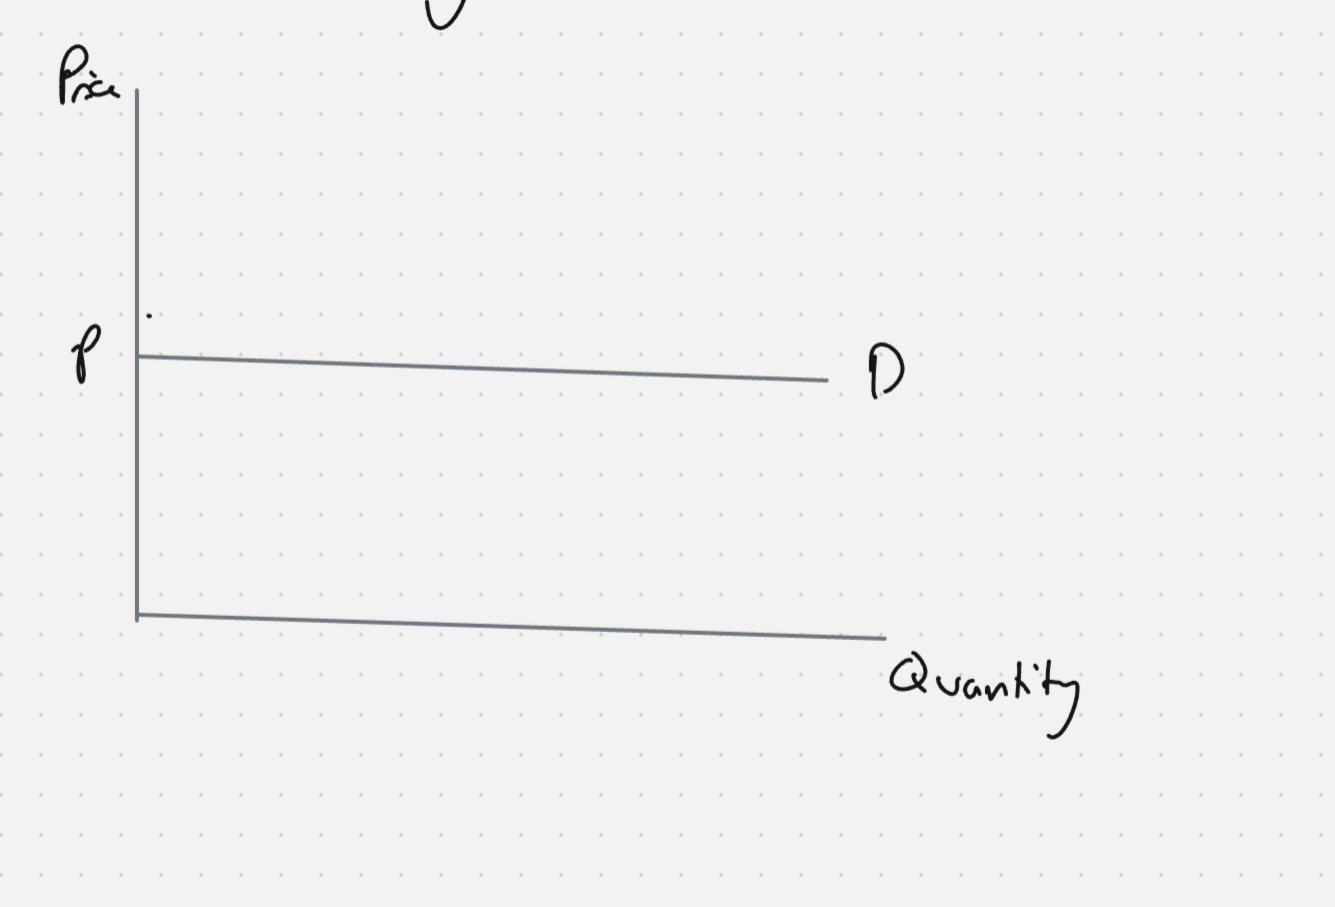
Perfectly elastic demand: This is when PED is infinite. A very small increase in price will result in a firm losing all of its customers.
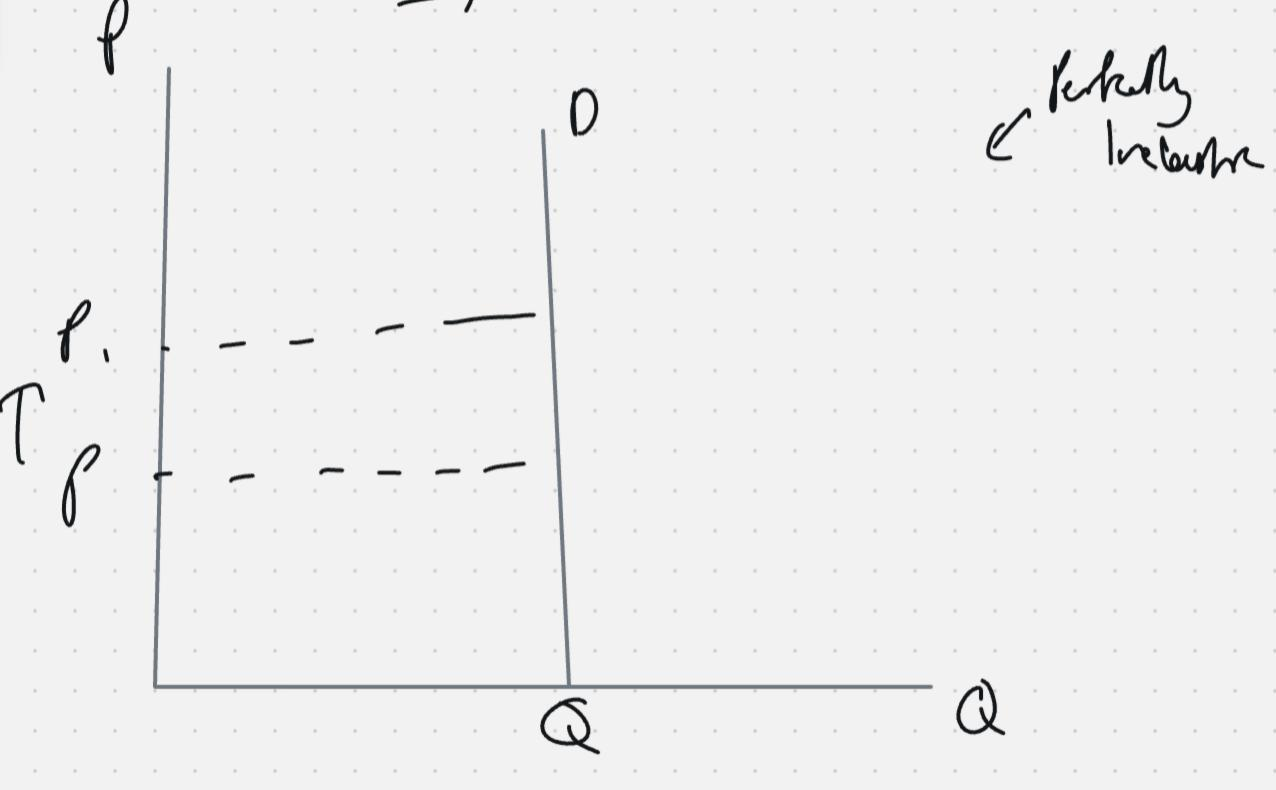
Perfectly inelastic demand: This is when PED is 0. A change in price results in no change in quantity demanded.
o income elasticity of demand: inferior, normal and luxury goods; relatively elastic and relatively inelastic
Positive YED: Normal goods / luxury goods (YED > 0)
If YED is positive, this means there is a positive correlation between income and quantity demanded.
If YED is positive and greater than 1, the good is a luxury good. This is a more income-elastic type of normal good, for example a luxury holiday.
If YED is positive but less than 1, the good is a normal good. For example, a YED of 0.8 shows a normal good, while a YED of 1.3 shows a luxury good.
Negative YED: Inferior goods (YED < 0)
If YED is negative, this means there is a negative correlation between income and quantity demanded. For example, as income rises, demand for bus travel may fall, so quantity demanded decreases.
o cross elasticity of demand: substitutes, complementary and unrelated goods
XED > 0: Substitutes
A rise in the price of one good leads to an increase in demand for the other good.
XED < 0: Complements
A rise in the price of one good leads to a fall in demand for the other good.
XED = 0: Unrelated goods
A change in the price of one good has no effect on the demand for the other good.
d) The factors influencing elasticities of demand
- Number of substitutes: if there are many alternatives then PED is most likely going to be elastic. This is because if the price of one good increases then consumers will just switch to the cheaper competitor's product.
- Quality→ e.g for the good to be elastic. → if the price goes down and demand goes up significantly, the quality may be very good. If price goes up and demand falls significantly, the quality must have been poor.
- Necessities: E.g milk, and food are all necessities. The PED for these is highly inelastic as if the price increases, consumers will only cut back on demand slightly because these are needed to survive.
- Proportion of income: If a good takes a large proportion of an individual's income, then the PED is elastic.
e) The significance of elasticities of demand to firms and government in terms of:
The significance of elasticities of demand to firms and government in terms of:
- PED helps firms and governments predict how consumers will respond to changes in prices, income, and related goods. This allows better decision making for policies and price changes.
o the imposition of indirect taxes and subsidies
- If demand is inelastic, that means consumers are not very responsive to price change. The government can raise indirect tax (VAT), prices will rise but demand will fall slightly. Hence, tax revenues will be higher.
- A subsidy is a grant/loan given to a firm from the government. This results in firms increasing supply and lowering there price. If demand is elastic, subsidies can result in a large increase in QD hence making subsidies more effective for firms.
o changes in real income
- If there is rising real incomes, there will be higher demand (if YED is +)
- If the YED is negative then there will be lower demand when income rises.
- This can help the government forecast future demand when income rises and its potential impact on their tax revenues.
o changes in the prices of substitute and complementary goods
- Price rise in a rival product → increase in demand (if + XED). Helps firms predict impact of competitors pricing and set strategic prices.
- Complements: Price rise in a related good → fall in demand. Firms may bundle products, joint promotions and other strategies to boost there sales using this XED data.
f) The relationship between price elasticity of demand and total revenue (including calculation)
Total revenue (TR) = price × quantity demanded (P × Q)
The effect of a price change on total revenue depends on the price elasticity of demand.
Elastic demand (PED > 1)
Demand is very responsive to a change in price.
If price falls, quantity demanded rises by a larger percentage, so total revenue increases.
If price rises, quantity demanded falls by a larger percentage, so total revenue decreases.
Example:
Price falls by 10%
Quantity demanded rises by 20%
Total revenue increases because the rise in quantity outweighs the fall in price.
Inelastic demand (PED < 1)
Demand is not very responsive to a change in price.
If price rises, quantity demanded falls by a smaller percentage, so total revenue increases.
If price falls, quantity demanded rises by a smaller percentage, so total revenue decreases.
Example:
Price rises by 10%
Quantity demanded falls by 5%
Total revenue increases because the rise in price outweighs the fall in quantity.
Unitary elastic demand (PED = 1)
Demand responds proportionately to a change in price.
A change in price leads to no change in total revenue.
Example:
Price falls by 10%
Quantity demanded rises by 10%
Total revenue remains the same.
1.2.4 Supply
a) The distinction between movements along a supply curve and shifts of a supply curve
1.2.4 SUPPLY
Supply: The quantity of a good or service a firm is willing and able to provide to consumers at a given price within any given time period.
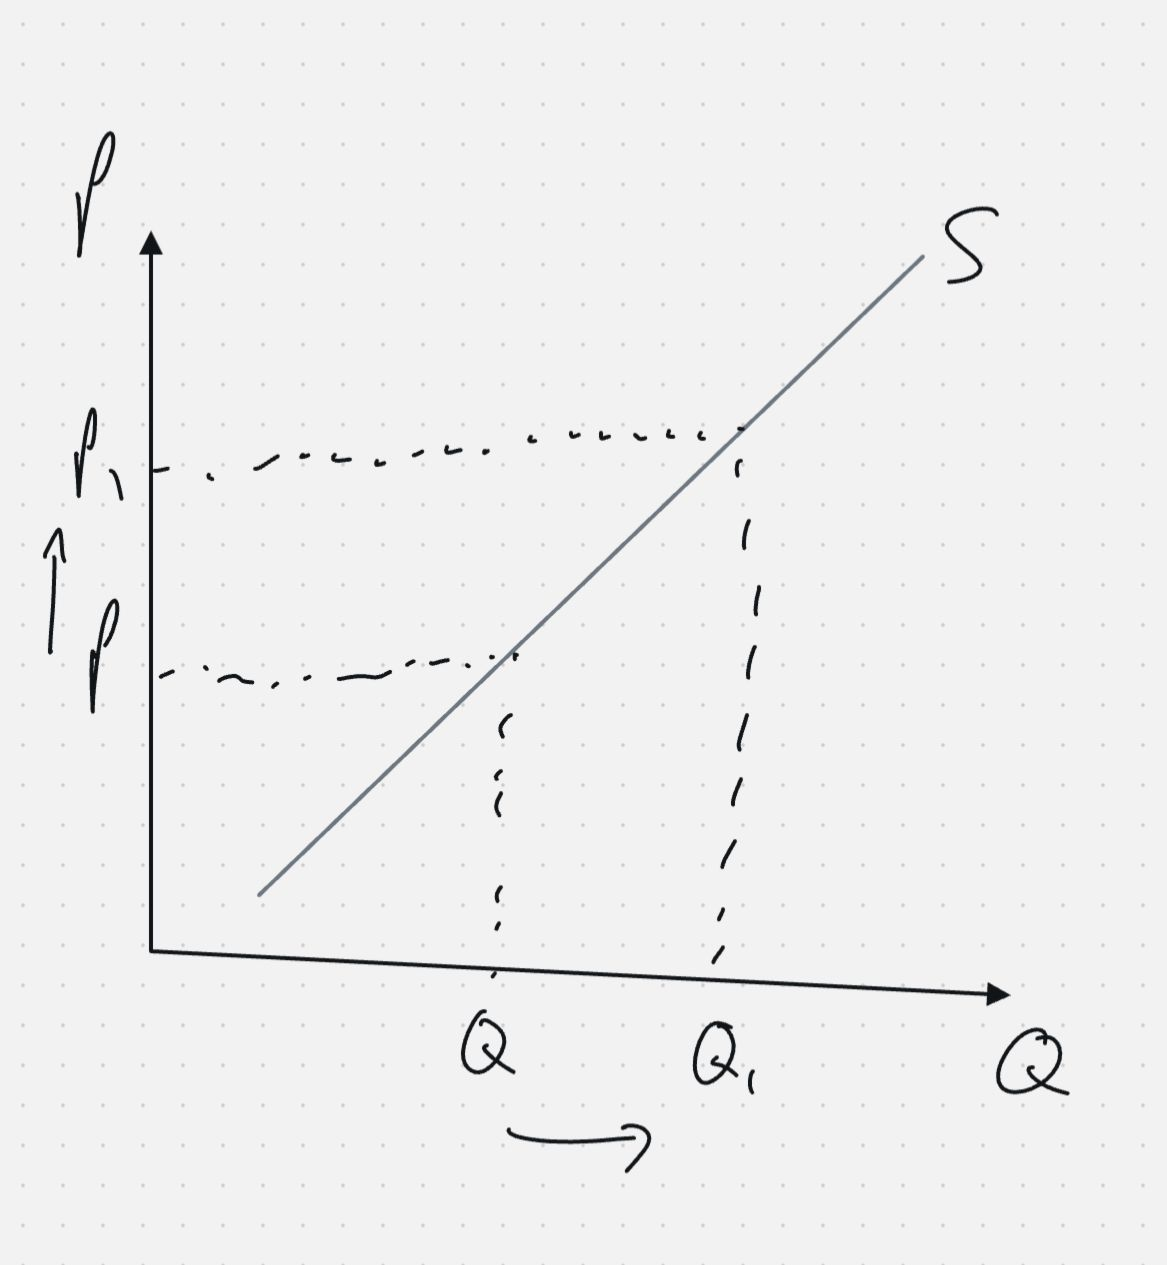
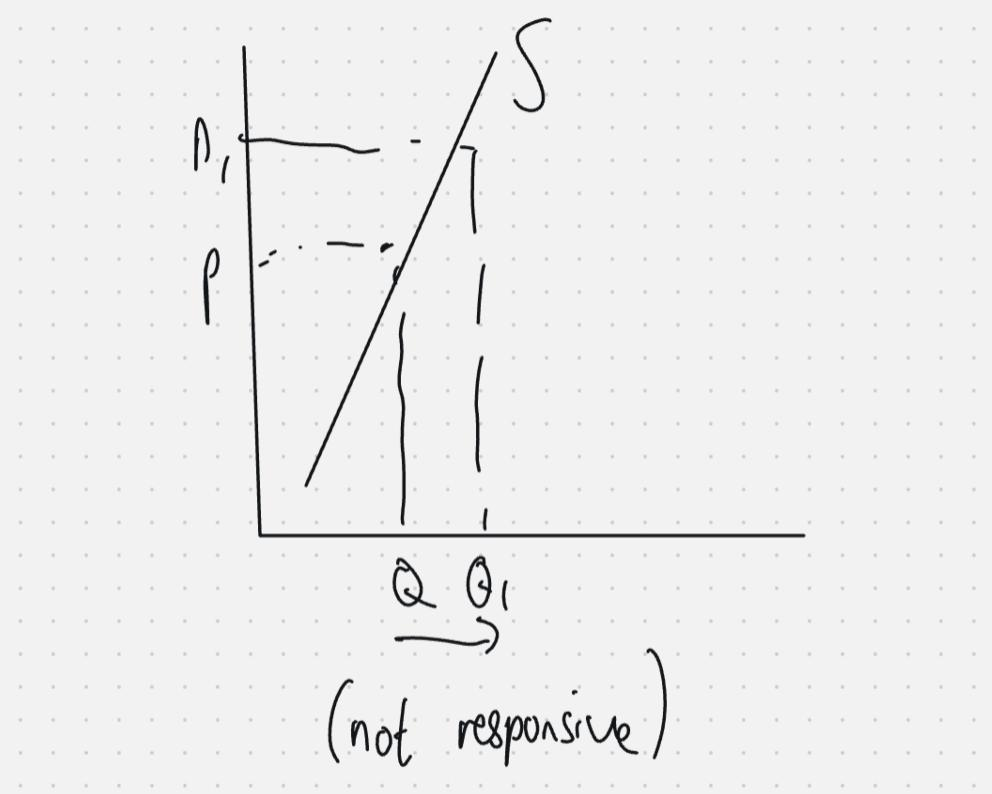
There is a positive correlation between quantity supplied and price. If the price rises from P to P1, there is an expansion of supply. This means quantity supplied expands from Q to Q1. This happens because a higher price provides an incentive for firms to supply more, as production becomes more profitable.
b) The factors that may cause a shift in the supply curve (the conditions of supply)
Shifts in the supply curve
- If something changes the costs of the firms, they will pass these costs onto consumers in the form of lower or higher prices.
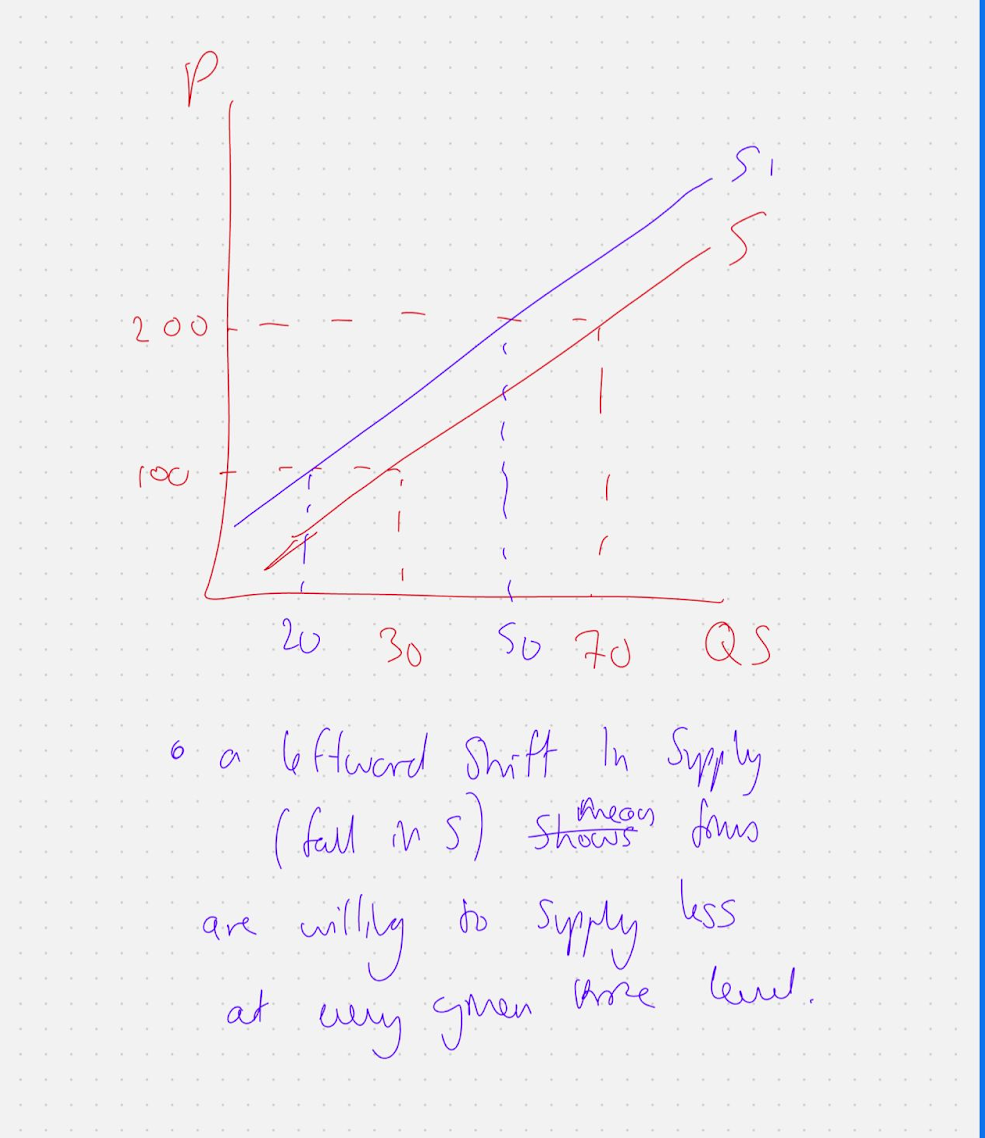
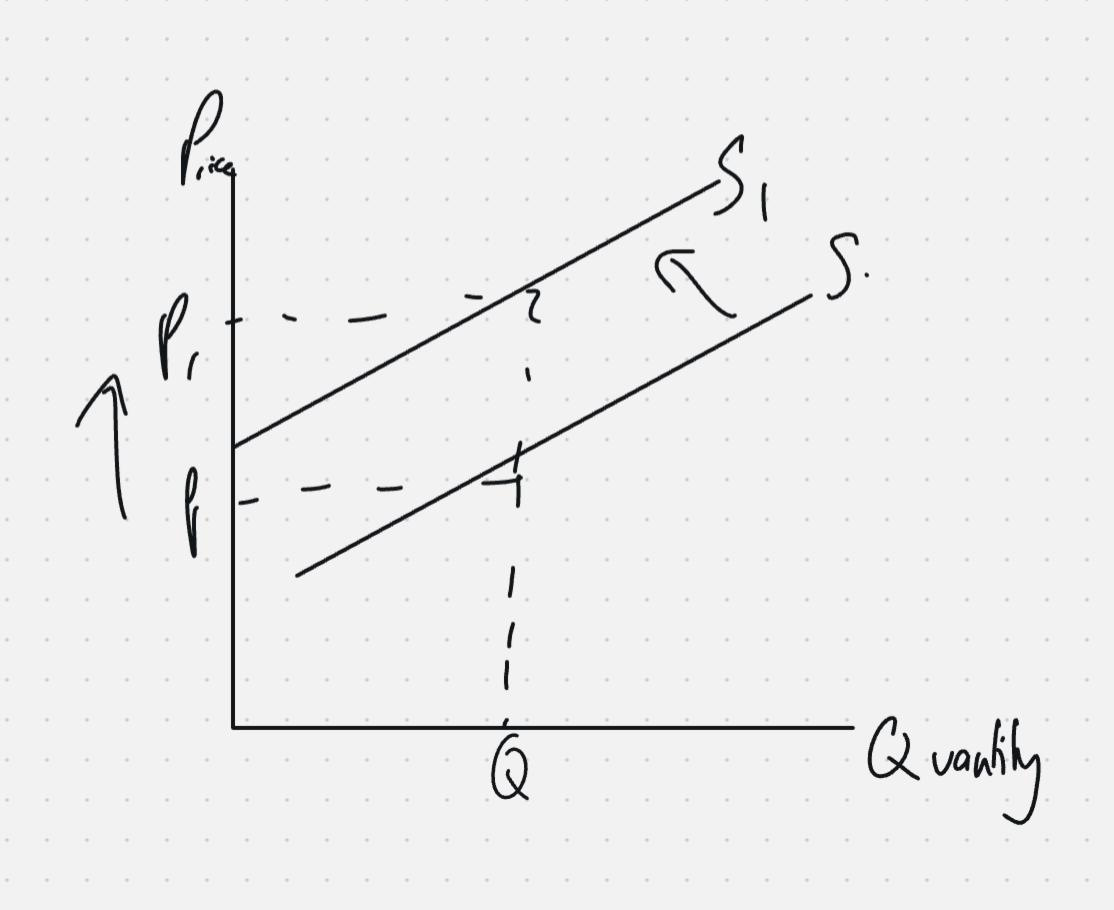
Unit costs of production/ price of raw materials: As a result of an increase in the price of raw materials, the supply curve will shift to the left from S to S1. This is because the firms costs of production have increased, so they will pass these costs onto consumers in the form of higher prices from P toP1 at quantity supplied, Q.
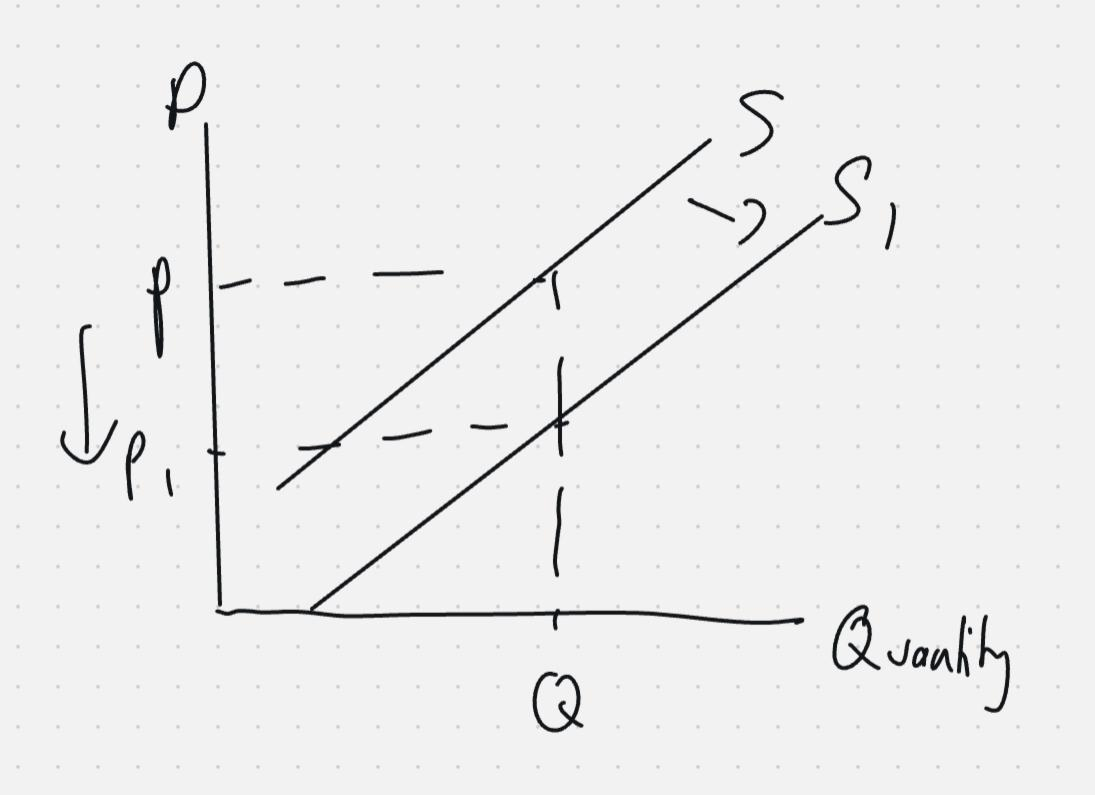
Lower Tax: As a result of a fall in taxation, a firm supply curve will shift to the right from S to S1. This is because the firms cost of production will fall, and hence they are willing to supply more at a lower price for every given price level. For example at Q, firms will reduce price from P to P1 as their costs are lower, they will also bring down prices.

Advancement in Technology: As a result of an advancement in technology, there is a rightward shift in supply from S to S1. This is because firms can easily expand production and produce more efficiently, hence reducing costs and incentivising more production. This can be seen on the diagram as at quantity Q, price has fallen from P to P1.

subsidies: As a result of a subsidy, the supply curve will shift to the right from S to S1, Subsidies are government loans which are provided to firms to incentivise them to increase supply and potentially lower prices. The firm may use the loan to expand production and hence charge a lower price of P1 at quantity Q.
Weather: if the weather is good, farmers are able to grow more crops and increase supply. They can therefore charge a lower price since there more productive and efficient.

Productivity: As a result of an increase in productivity, the supply curve will shift to the right. This is because firms are more efficient and hence there costs will fall. Firms will be more willing to charge lower prices at every given quantity. For example at Q they have reduced price from P to P1.

1.2.5 Elasticity of supply
a) Understanding of price elasticity of supply
Price elasticity of supply (PES) is the responsiveness of quantity supplied to a change in price.
b) Use formula to calculate price elasticity of supply
Formula: PES = % change in quantity supplied ÷ % change in price
PES is always positive because quantity supplied and price have a positive correlation. That is, they move in the same direction, so the calculation always gives a positive value.
c) Interpret numerical values of price elasticity of supply: perfectly and relatively elastic, and perfectly and relatively inelastic
Elastic (PES > 1) Supply is very responsive to a change in price. For example, if the price goes up, firms can easily increase their supply significantly to take advantage of higher profits.
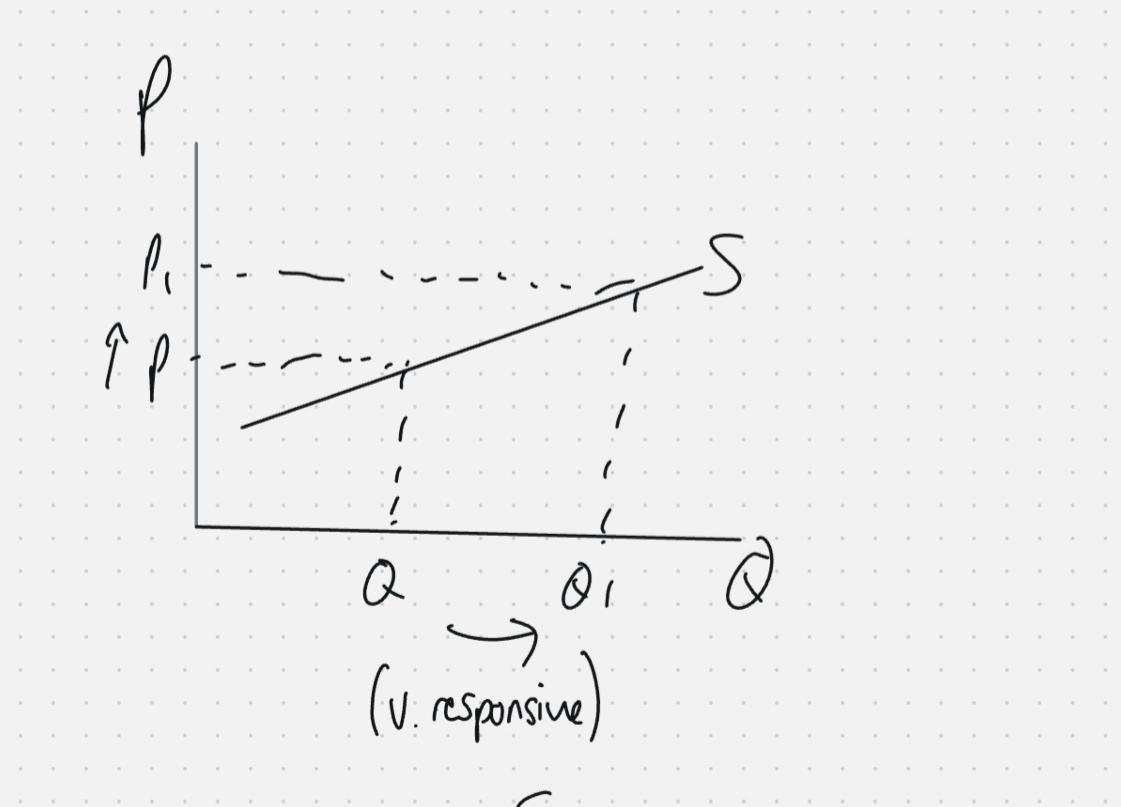
Inelastic (PES < 1) Supply is not very responsive to a change in price. For example, if the price of a good goes up, firms are not able to easily increase supply quickly or significantly to capitalize on higher profits.
Perfectly Elastic (PES = ∞)
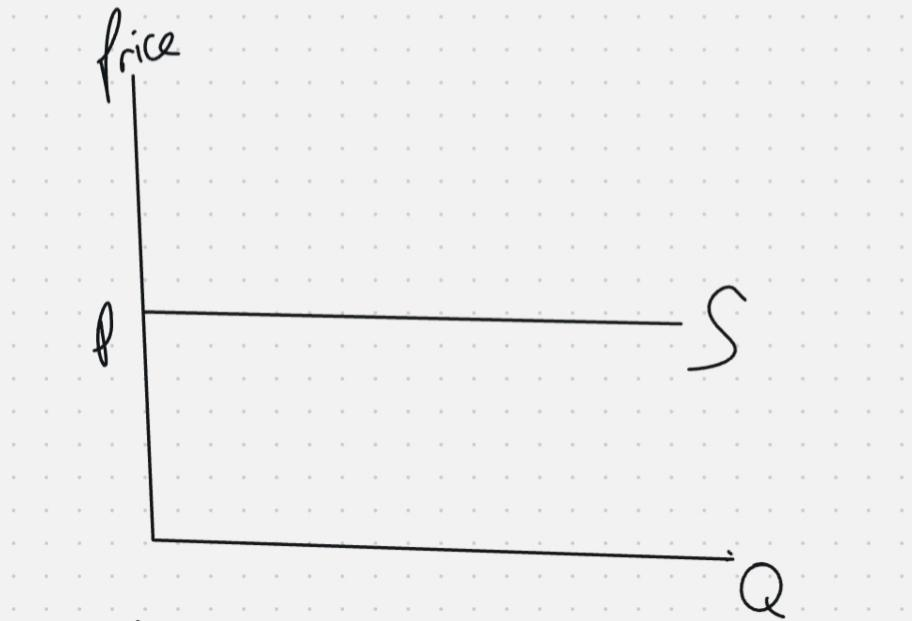
Supply is infinitely responsive to a change in price. Firms are willing to supply any quantity at a given price, but none at a lower price. Even a very small change in price leads to an infinite change in quantity supplied.
Perfectly Inelastic (PES = 0)
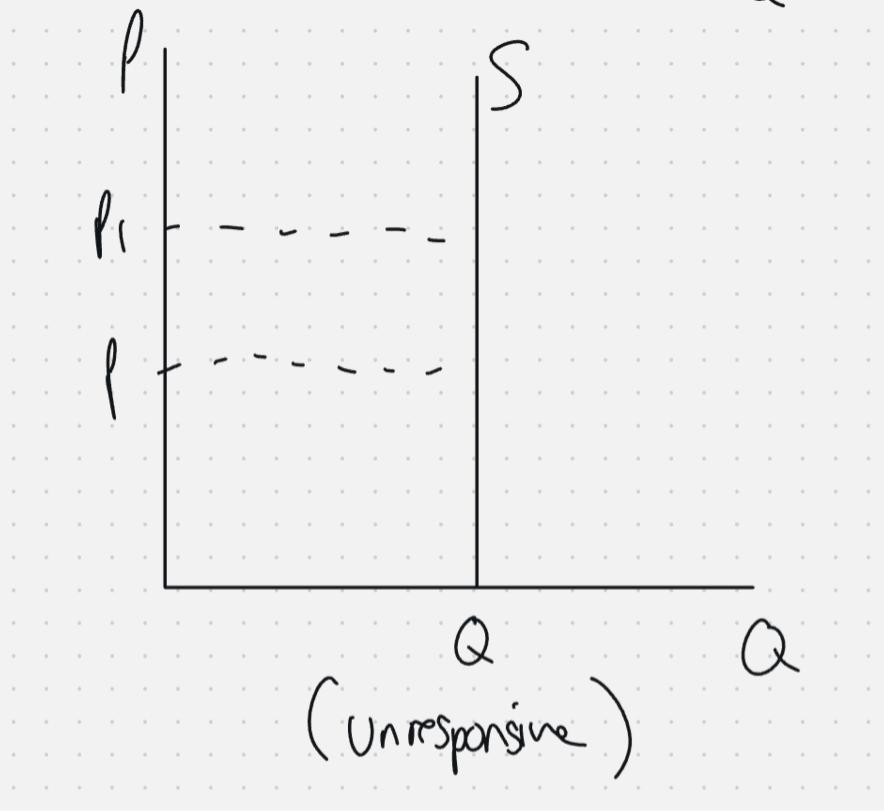
Supply is completely unresponsive to a change in price. The quantity supplied is fixed, regardless of how much the price changes. For example, goods with a fixed supply in the short run cannot increase output even if prices rise.
d) Factors that influence price elasticity of supply
- Flexible resources: Resources that can be used for multiple purposes, such as skilled workers. For example, if the demand for another good rises, these resources can be quickly redirected to produce it efficiently. This makes supply more responsive.
- Spare capacity: If a firm has unused capacity or storage space, it can increase supply quickly when prices rise by releasing stored goods onto the market.
- Time: Supply tends to become more elastic over time, as firms have more opportunity to adjust production levels.
e) The distinction between short run and long run in economics and its significance for elasticity of supply
In economics, the short run is a period of time in which at least one factor of production is fixed (for example, capital such as machinery or factory size). In the long run, all factors of production are variable.
In the short run, supply tends to be more inelastic because firms cannot quickly increase production due to fixed factors. Even if prices rise, firms may struggle to expand output significantly.
In the long run, supply tends to be more elastic because firms can change all factors of production. They can invest in new machinery, expand factories, or allow new firms to enter the market, making supply more responsive to price changes.
1.2.6 Price determination
a) Equilibrium price and quantity and how they are determined
The equilibrium price is the price at which quantity demanded equals quantity supplied. At this price, the market clears and there is no tendency for price to change. The equilibrium quantity is the amount bought and sold at the price. Equilibrium is determined by the interaction of consumers willing to buy (Demand) and producers willingness to sell (supply).
b) The use of supply and demand diagrams to depict excess supply and excess demand
Excess Supply (Disequilibrium)
- Excess supply occurs when the price is above the equilibrium level, causing the QS to be greater than the QD. At this higher price, firms find it more profitable so are willing to produce more at QS, whereas there is a contraction in demand from consumers to QD. Thus, leading to an excess supply of QS-QD.
Excess Demand (Disequilibrium)
- Excess demand occurs when the price is below the equilibrium level, causing QD to be greater than QS. At this lower price, consumers want to buy more than firms are willing or able to supply, leading to a shortage.
c) The operation of market forces to eliminate excess demand and excess supply
Market forces: refers to the interaction between demand and supply in a market, which determines the price and quantity of a good. They reflect the behaviour of consumers and firms as they respond to changes in price.
- When there is excess supply, the price is above equilibrium. Firms are left with unsold stock and respond by lowering prices. As prices fall, QD rises and QS falls, reducing the surplus.
- When there is excess demand, the price is below equilibrium. Consumers compete for the limited supply, which allows firms to raise prices. As prices rise, QD falls and QS rises, reducing the shortage.
d) The use of supply and demand diagrams to show how shifts in demand and supply curves cause the equilibrium price and quantity to change in real-world situations
Examples:
Using a Supply and Demand Diagram, explain the impact on equilibrium if there is an increase in taxation?
As a result of an increase in taxation, there is a leftward shift in supply from S to S1. This is because there is a rise in costs for the firm, so they will pass these costs onto consumers in the form of higher prices. This results in a new equilibrium at a higher price of P1 and fall in quantity supplied and demanded at Q1.
Using a Supply and Demand Diagram, explain the impact on equilibrium if there is an increase in disposable income?
As a result of an increase in incomes, there is a rightward shift in demand from D to D1. This is because as consumers have more purchasing power, they are more willing to buy the goods at every given price level. This results in a new equilibrium at a higher price of P1 and QD & QS of Q1.
1.2.7 Price mechanism
Price Mechanism: Is the way prices adjust through demand and supply to allocate resources in a market economy.
a) Functions of the price mechanism to allocate resources:
o rationing
Prices will ration the scarce resources by controlling who can afford the goods. For example, when demand exceeds supply, prices rise, meaning only those willing and able to pay the higher price can buy the product. Conversely, if supply exceeds demand, prices fall and reduces wastage.
o incentive
Prices provide incentives for producers and consumers to adjust their behaviour. For producers, higher prices signal the potential for higher profits, encouraging them to supply more. For consumers, higher prices discourage consumption whilst lower prices encourage people to buy more.
o signalling
Price changes send contrasting messages to consumers and producers about whether to enter or leave a market. Rising prices give a signal to consumers to reduce demand or withdraw from a market completely, and they give a signal to potential producers to enter a market. Conversely, falling prices give a positive message to consumers to enter a market while sending a negative signal to producers to leave a market.
b) The price mechanism in the context of different types of markets, including local, national and global markets
- Local markets: Prices respond quickly to local supply and demand changes. For example, a shortage of fruit in a local market raises prices, encouraging local farmers to supply more.
- National markets: Prices reflect larger-scale demand and supply factors, including transport, regulation, and nationwide trends. For example, fuel prices may rise across the country due to increased demand or rising crude oil costs.
- Global markets: Prices are influenced by international supply and demand, exchange rates, and global events. For example, a drought in Brazil can raise global coffee prices, affecting local markets worldwide.
1.2.8 Consumer and producer surplus
a) The distinction between consumer and producer surplus & b) The use of supply and demand diagrams to illustrate consumer and producer surplus
Consumer surplus: Consumer surplus is when the price consumers pay is less than what they were willing to pay. For example, if they were willing to pay a price of £40 and ended up paying only £25, then their consumer surplus is the £15 value they got.
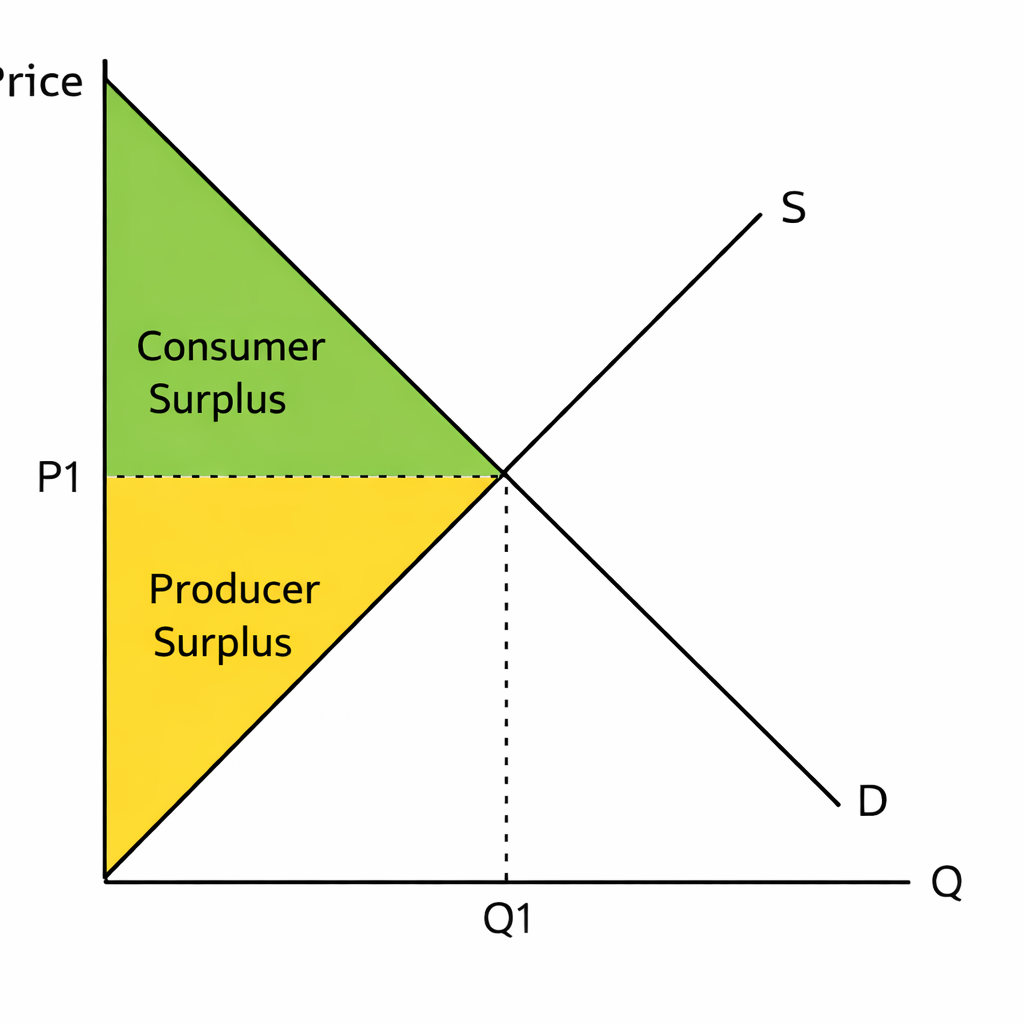
Producer surplus: This is the difference between the price firms receive and what they were willing to sell the good at. For example, they may have been willing to sell the product at £20, but the equilibrium price was £45, so there producer surplus is £25.
c) How changes in supply and demand might affect consumer and producer surplus
As a result of a rise in incomes, more consumers are willing to buy computers. This results in a rightward shift in demand from D1 to D2 and a higher price and quantity of Q2,P2. As producers are now receiving a higher price, they will experience an increase in producer surplus shown by the grey-shaded region.
Show the effect of an advancement in technology on consumer surplus?
As a result of an advancement in technology, there is a rightward shift in supply from S to S1. This is because the firm is more efficient and hence costs will fall, so they are willing to charge lower prices and produce more. This results in a new equilibrium of P1 and Q1, and thus decreases consumer surplus from shaded region ABP to ACP1.
1.2.9 Indirect taxes and subsidies
a) Supply and demand analysis, elasticities, and:
o the impact of indirect taxes on consumers, producers and government
An indirect tax is a tax on goods and services, such as VAT. It affects the market by raising the price of the product.
Consumers pay more for the good, hence reducing their consumer surplus. This leads to lower demand for the product.
Producers receive less revenue after paying the tax to the government, thus reducing producer surplus. The highers costs lead to firms cutting back in supply and thus shifting supply to the left.
The government gains revenue, but it creates a deadweight loss (inefficiency in the market) as consumer and producer surplus both fall.
o the incidence of indirect taxes on consumers and producers
Incidence of Tax: How the burden of tax is distributed between firms and consumers.
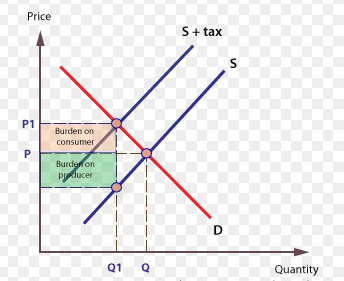
- If demand is inelastic, firms can pass a large portion of the tax burden onto consumers through higher prices. This is because quantity demanded is not very responsive to a price increase, so consumers continue to buy the good. As a result, producers pay relatively little of the tax themselves.
o the impact of subsidies on consumers, producers and government
impact of Subsidies
A subsidy is a payment by the government to producers to lower their costs and encourage production.
On producers:
- Reduces production costs, increasing supply.
- Leads to higher output and potentially higher profits.
On consumers:
- Lower prices due to increased supply.
- Greater quantity of goods available, so consumers benefit from more choice and affordability.
On government:
- Subsidies are a cost to the government, funded from taxes.
- Can be used to encourage production of socially desirable goods (e.g., renewable energy).
- Risk of inefficient allocation if producers become reliant on subsidies.
o the area that represents the producer subsidy and consumer subsidy
When a government gives a subsidy:
- The supply curve shifts right (from S to S1).
- The equilibrium price falls from P to P1, and quantity rises from Q to Q1.
Areas on the diagram:
- Consumer benefit: The area between the old price (P) and the new price (P1), up to the new quantity (Q1). This represents how much cheaper the good is for consumers.
- Producer benefit: The area between the old supply curve and the new supply curve, up to the new quantity (Q1). This represents the extra revenue producers receive from the subsidy.
1.2.10 Alternative views of consumer behaviour
a) The reasons why consumers may not behave rationally:
- Influence of other people’s behaviour: Consumers may make choices based on trends, peer pressure, or social norms rather than logical evaluation of costs and benefits.
- Habitual behaviour: Consumers often stick to familiar choices or brands out of habit, even if alternatives might offer better value.
- Weakness at computation: Consumers may struggle to process complex information, compare prices, or calculate long-term costs, leading to decisions that are not fully rational.